Statistics for Past Aavegotchi Raffles
Last updated on by
Contributors

How many raffle tickets were submitted in past raffles? How many were there in each category? We have the historical data for past raffles for you here!
Probability is defined as:
Total Number of Prizes in a given category / Total Number of Tickets submitted for that same category
Wearable Raffles
Raffle 1 (Chainlink Theme)
10 - 13 November 2020
| Category | Prizes | Tickets submitted | Probability |
|---|
| Common | 3000 | 47515 | 0.06313796 |
| Uncommon | 1500 | 14290 | 0.1049685 |
| Rare | 900 | 13404 | 0.06714414 |
| Legendary | 450 | 8287 | 0.05430192 |
| Mythical | 150 | 3896 | 0.03850103 |
| Godlike | 10 | 1570 | 0.006369427 |
Raffle 2 (Aave Theme)
8 - 11 December 2020
| Category | Prizes | Tickets submitted | Probability |
|---|
| Common | 3000 | 66569 | 0.04506602 |
| Uncommon | 1500 | 24773 | 0.06054979 |
| Rare | 750 | 26439 | 0.02836718 |
| Legendary | 300 | 13463 | 0.02228329 |
| Mythical | 150 | 6200 | 0.02419355 |
| Godlike | 15 | 1388 | 0.01080692 |
Raffle 3 (Ethereum Theme)
31 December 2020 - 3 January 2021
| Category | Prizes | Tickets submitted | Probability |
|---|
| Common | 3000 | 49190 | 0.06098801 |
| Uncommon | 1500 | 18717 | 0.08014105 |
| Rare | 750 | 22289 | 0.03364889 |
| Legendary | 300 | 12008 | 0.02498334 |
| Mythical | 200 | 6724 | 0.0297442 |
| Godlike | 15 | 1220 | 0.01229508 |
Raffle 4 (Layer 2 Theme)
29 March - 1 April 2021
| Category | Prizes | Tickets submitted | Probability |
|---|
| Common | 6000 | 348885 | 0.01719764 |
| Uncommon | 3250 | 111040 | 0.02926873 |
| Rare | 1625 | 128783 | 0.01261813 |
| Legendary | 450 | 43120 | 0.01043599 |
| Mythical | 175 | 30541 | 0.005730002 |
| Godlike | 13 | 7348 | 0.001769189 |
Raffle 5 (Partnerships Theme)
24 September - 27 September 2021
| Category | Prizes | Tickets submitted | Probability |
|---|
| Common | 3000 | 416438 | 0.007203954 |
| Uncommon | 1500 | 116174 | 0.01291167 |
| Rare | 750 | 138678 | 0.005408212 |
| Legendary | 300 | 56839 | 0.005278066 |
| Mythical | 150 | 50221 | 0.002986798 |
| Godlike | 15 | 10636 | 0.001410305 |
Raffle 6 (DeFi RPG Theme)
26 - 29 January 2022
| Category | Prizes | Tickets submitted | Probability |
|---|
| Common | 5000 | 1526284 | 0.00327593 |
| Uncommon | 2000 | 303086 | 0.006598787 |
| Rare | 1000 | 211757 | 0.004722394 |
| Legendary | 400 | 78507 | 0.005095087 |
| Mythical | 200 | 50014 | 0.00399888 |
| Godlike | 15 | 6171 | 0.002430724 |
Portal Raffles
Raffle 1 (Haunt 2 Portal Drop)
5 - 8 September 2021
| Category | Prizes | Tickets submitted | Probability |
|---|
| Drop Ticket | 3000 | 77086 | 0.03891757 |
Land Raffles
Raffle 1
5 - 8 November 2021
| Category | Prizes | Tickets submitted | Probability |
|---|
| Drop Ticket | 4000 | 151997 | 0.02631631 |
Raffle 2
10 - 13 December 2021
| Category | Prizes | Tickets submitted | Probability |
|---|
| Drop Ticket | 3000 | 83996 | 0.03571599 |
FAKE Gotchis Card Raffle
9 - 12 November 2022
| Category | Prizes | Tickets submitted | Probability |
|---|
| Drop Ticket | 1500 | 47633 | 0.03149077 |
Forge Schematics Raffle
10 - 13 March 2023
| Category | Prizes | Tickets submitted | Probability |
|---|
| Common | 1600 | 809114 | 0.001977472 |
| Uncommon | 400 | 98614 | 0.004056219 |
| Rare | 200 | 71737 | 0.002787962 |
| Mythical | 80 | 17692 | 0.004521818 |
| Godlike | 8 | 6393 | 0.001251369 |
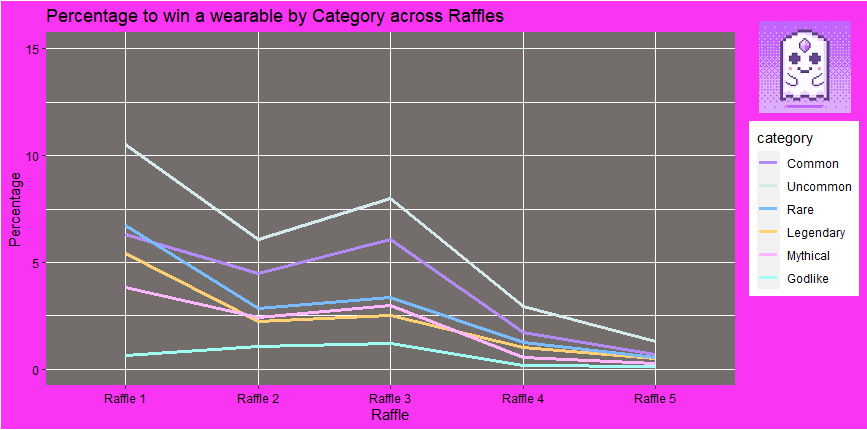
Chart
What are your chances (in percentage) to win a wearable using 1 ticket in past wearable raffles? Check out the chart below.